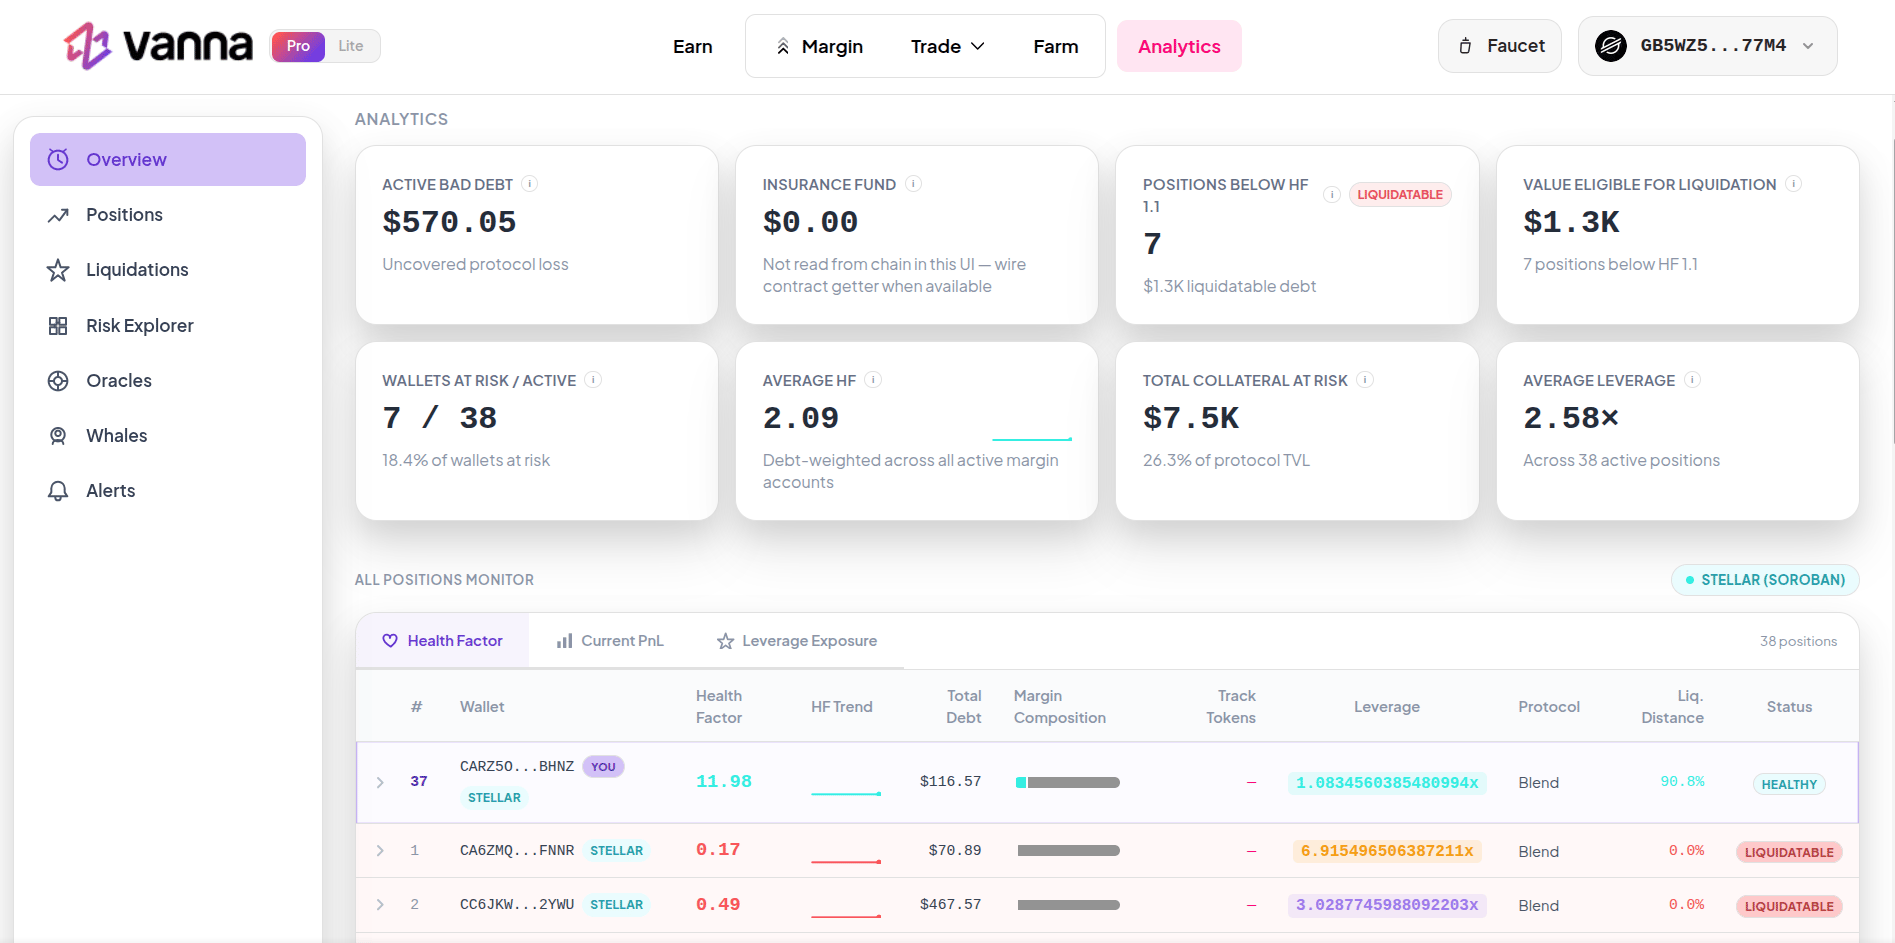

The Risk Monitoring Dashboard is a protocol-level risk intelligence tool available in Pro Mode. It serves two purposes:
  • For your own positions: Monitor your open Margin Account positions, track your Health Factor in real time, and understand how much room you have before liquidation.
  • For the protocol: See the overall risk state of every active margin account on the protocol, track bad debt and liquidation activity, and run stress simulations to understand how market crashes or extreme scenarios would impact both your positions and the protocol as a whole. Risk Monitoring Dashboard Overview
Whether you want to stay on top of your own risk or evaluate systemic risk across the entire protocol, the Risk Monitoring Dashboard gives you the tools to do both.
The Risk Monitoring Dashboard is available in Pro Mode only. Switch to Pro using the Pro / Lite toggle in the top navigation.

What it shows

The dashboard tracks the overall risk state of the protocol across all active margin accounts. Key top-level metrics:
MetricWhat it means
Active Bad DebtUncovered protocol loss from positions where debt exceeds collateral
Insurance FundReserve available to cover bad debt
Positions Below HF 1.1Number of accounts eligible for liquidation + total debt at risk
Value Eligible for LiquidationTotal debt value in liquidatable positions
Average Health FactorDebt-weighted HF across all active margin accounts
Total Collateral at RiskUSD value of collateral backing positions with HF below 1.5
Average LeverageDebt-weighted leverage across all active accounts
System Health ScoreComposite 0–100 score reflecting overall protocol risk level

Health Factor status thresholds

StatusHealth FactorMeaning
🟢 HealthyHF ≥ 1.5Position is comfortably safe
🟡 WarningHF 1.3 – 1.5Approaching risk zone
🟠 CriticalHF 1.1 – 1.3Close to liquidation threshold
🔴 LiquidatableHF < 1.1Eligible for liquidation

Dashboard sections

Positions

All active margin accounts ranked by Health Factor, PnL, or leverage. Expand any row to see the full margin breakdown and liquidation distance.

Liquidations

Monitor recent liquidation events and wallets currently eligible for liquidation.

Risk Explorer

Run stress simulations - single asset crash, multi-asset correlated crash, stablecoin depeg, and more.

Before you start

  • You must be in Pro Mode - switch using the Pro / Lite toggle in the top navigation.
  • The dashboard uses live on-chain data and oracle price feeds, refreshing approximately every 30 seconds.